Galerie d'images pour le concours d'illustrations scientifiques Géotechnique – CERMES
Vous trouverez ci-dessous la liste d’images soumises lors du concours d’illustrations scientifiques de l’équipe Géotechnique – CERMES. Le vote s’effectue au lien suivant :
https://live.tiermaker.com/17918172
Description
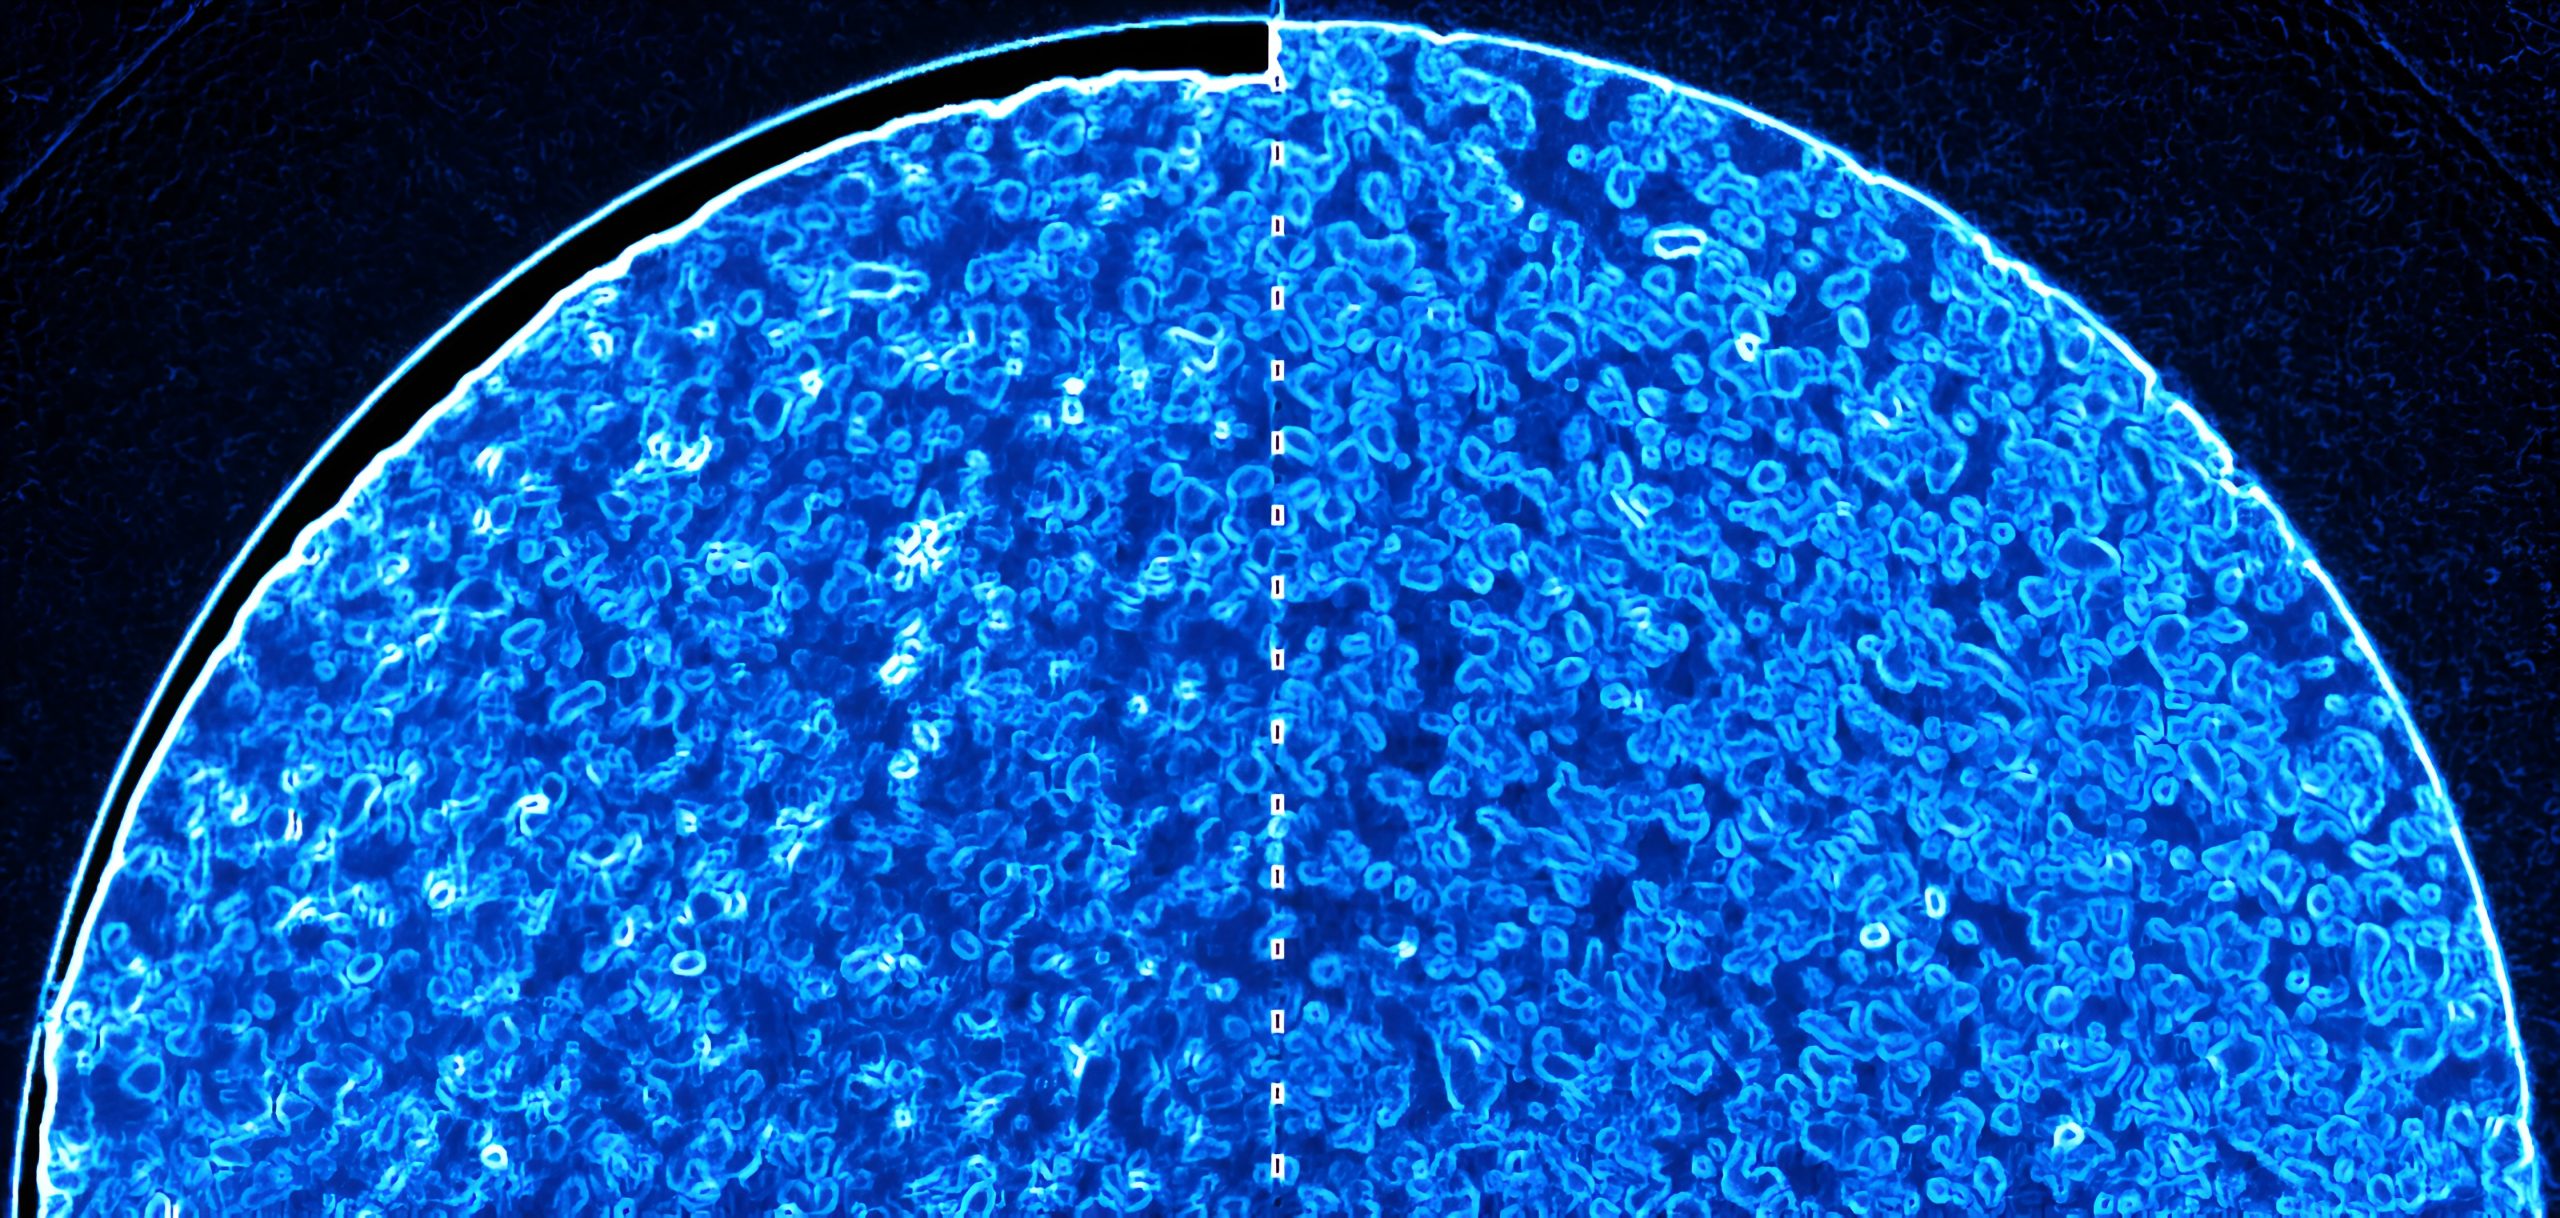
The image consists of a symmetrical comparison of a cylindrical sample of compacted bentonite-sand mixture at ambient conditions (left) and water-saturated (right) at confined conditions. Edge detection via Sobel filtering highlights sand grains and porosity contours. The effects of water-induced swelling are appreciable in the closure of the external gap and in the homogenisation, with macropore contours (brightest contours in the left image) are barely visible after hydration. A final colour-balance adjustment provides the saturated blue tonality, improving its aesthetics.

Description
Geological hydrogen storage, especially storage in porous medium, is the best large-scale and long-term solution to balance the seasonal supply-demand mismatch of renewable energy. Due to seasonal injection and recovery of gas, the reservoir rock is subjected to cyclic pressure changes. The image shows the process of hydrogen production, storage and use, highlighting the cyclic behaviour of reservoir rocks that can be observed at the laboratory scale.

Description
Saint-Maximin Limestone (SML), characterized by a high macro porosity of about 35% and a permeability of about 5 mD, is selected as a typical reservoir rock for geological hydrogen storage application. The picture shows the SML sample (left half) and its SEM scan (right half).The pore space in the SEM is filled in blue to emphasise the storage space for hydrogen.

Description
Schéma montrant la propagation de fissures à partir de l’extrémité de fractures existantes des deux côtés d’un tunnel sous l’effet d’une injection de fluide, analysée par des calculs en élément finis enrichis par des éléments joints pour un matériau monophasique.

Description
Analytical, empirical, numerical, and data-driven approaches are emphasized to analyze the behavior of tunnels in both short and long-term scenarios. These methods are integrated into a framework for assessing tunnel design. Starting from in-situ convergence measurements, constitutive parameters are first determined using a back-analysis technique based on analytical and empirical formulations. Then, the ground-lining interaction is considered through the use of machine learning surrogate models that adopt the bagging procedure and rely on synthetic datasets generated from numerical modeling. Because of its relative simplicity, this framework could help lead to optimized and sustainable designs.

Description
Profilometric scan of a tensile crack surface in cement, accompanied by a map of local slope variations, illustrating the percolation of damage.

Description
A 2D view of a porosimetry simulation conducted on a 3D binary image of a synthetic rock made from sintered glass beads. The simulation is done by using the local thickness method from PoreSPY liberary. This method is designed to avoid the “Ink bottle effect" of serial pores geometry. The coloured particles represent the pores, while the colours represent the pore sizes. The dark particles represent the glass beads.

Description
This image showcases a unique sample that has been scanned using microtomography. The distinct stratification of Anhydrite/Gypsum (white) and clay (gray), deposited over geological time periods, is clearly visible. The anhydrite appears in the sample as layers, veins (upper middle section), and within fractures. Surrounding the sample are small glass beads that help maintain its position during the scan.

Description
Schéma illustrant la propagation asymétrique d’une paire de fissures des deux cotes d’une galerie de stockage sous l’effet d’une injection de fluide, analysée par des calculs en élément finis enrichis par des éléments joints pour un matériau monophasique.

Description
The image depicts a microtomography scan of an oedometer sample taken before the oedometer test. The sample consists of clay-sulfate rock, showcasing the distinctive layering of clay (gray) and Anhydrite/Gypsum (white). Additionally, the image reveals the mixing of these layers caused by geological processes.

Description
Cette image illustre un essai isotrope en cours, visant à étudier les propriétés thermo-hydro-mécaniques d’un échantillon poreux. Le ruban chauffant orange sur l’appareil crée un contraste avec les autres teintes de la scène. Au premier plan, un échantillon en forme de disque, équipé de jauges de déformation, souligne le contraste de taille entre l’échantillon et l’appareil. À l’arrière-plan, les deux pompes marron sont utilisés pour contrôler la pression de confinement et la pression interstitielle, ce qui démontre la complexité et la spécialisation de l’appareil.

Description
Schéma illustrant la déviation de la trajectoire de propagation d’une fissure à partir de l’extrémité d’une fracture existante dans un matériau poreux non saturée en fonction de la direction des contraintes principales de terrain, analysée par des calculs en élément finis enrichis par des éléments joints.

Description
In the image, one can see the propagation of a shear, frictionless crack in a disordered medium. The color between crack front position represents the amount of energy dissipated due to the crack front’s advancement from its current position to the next one.
Description
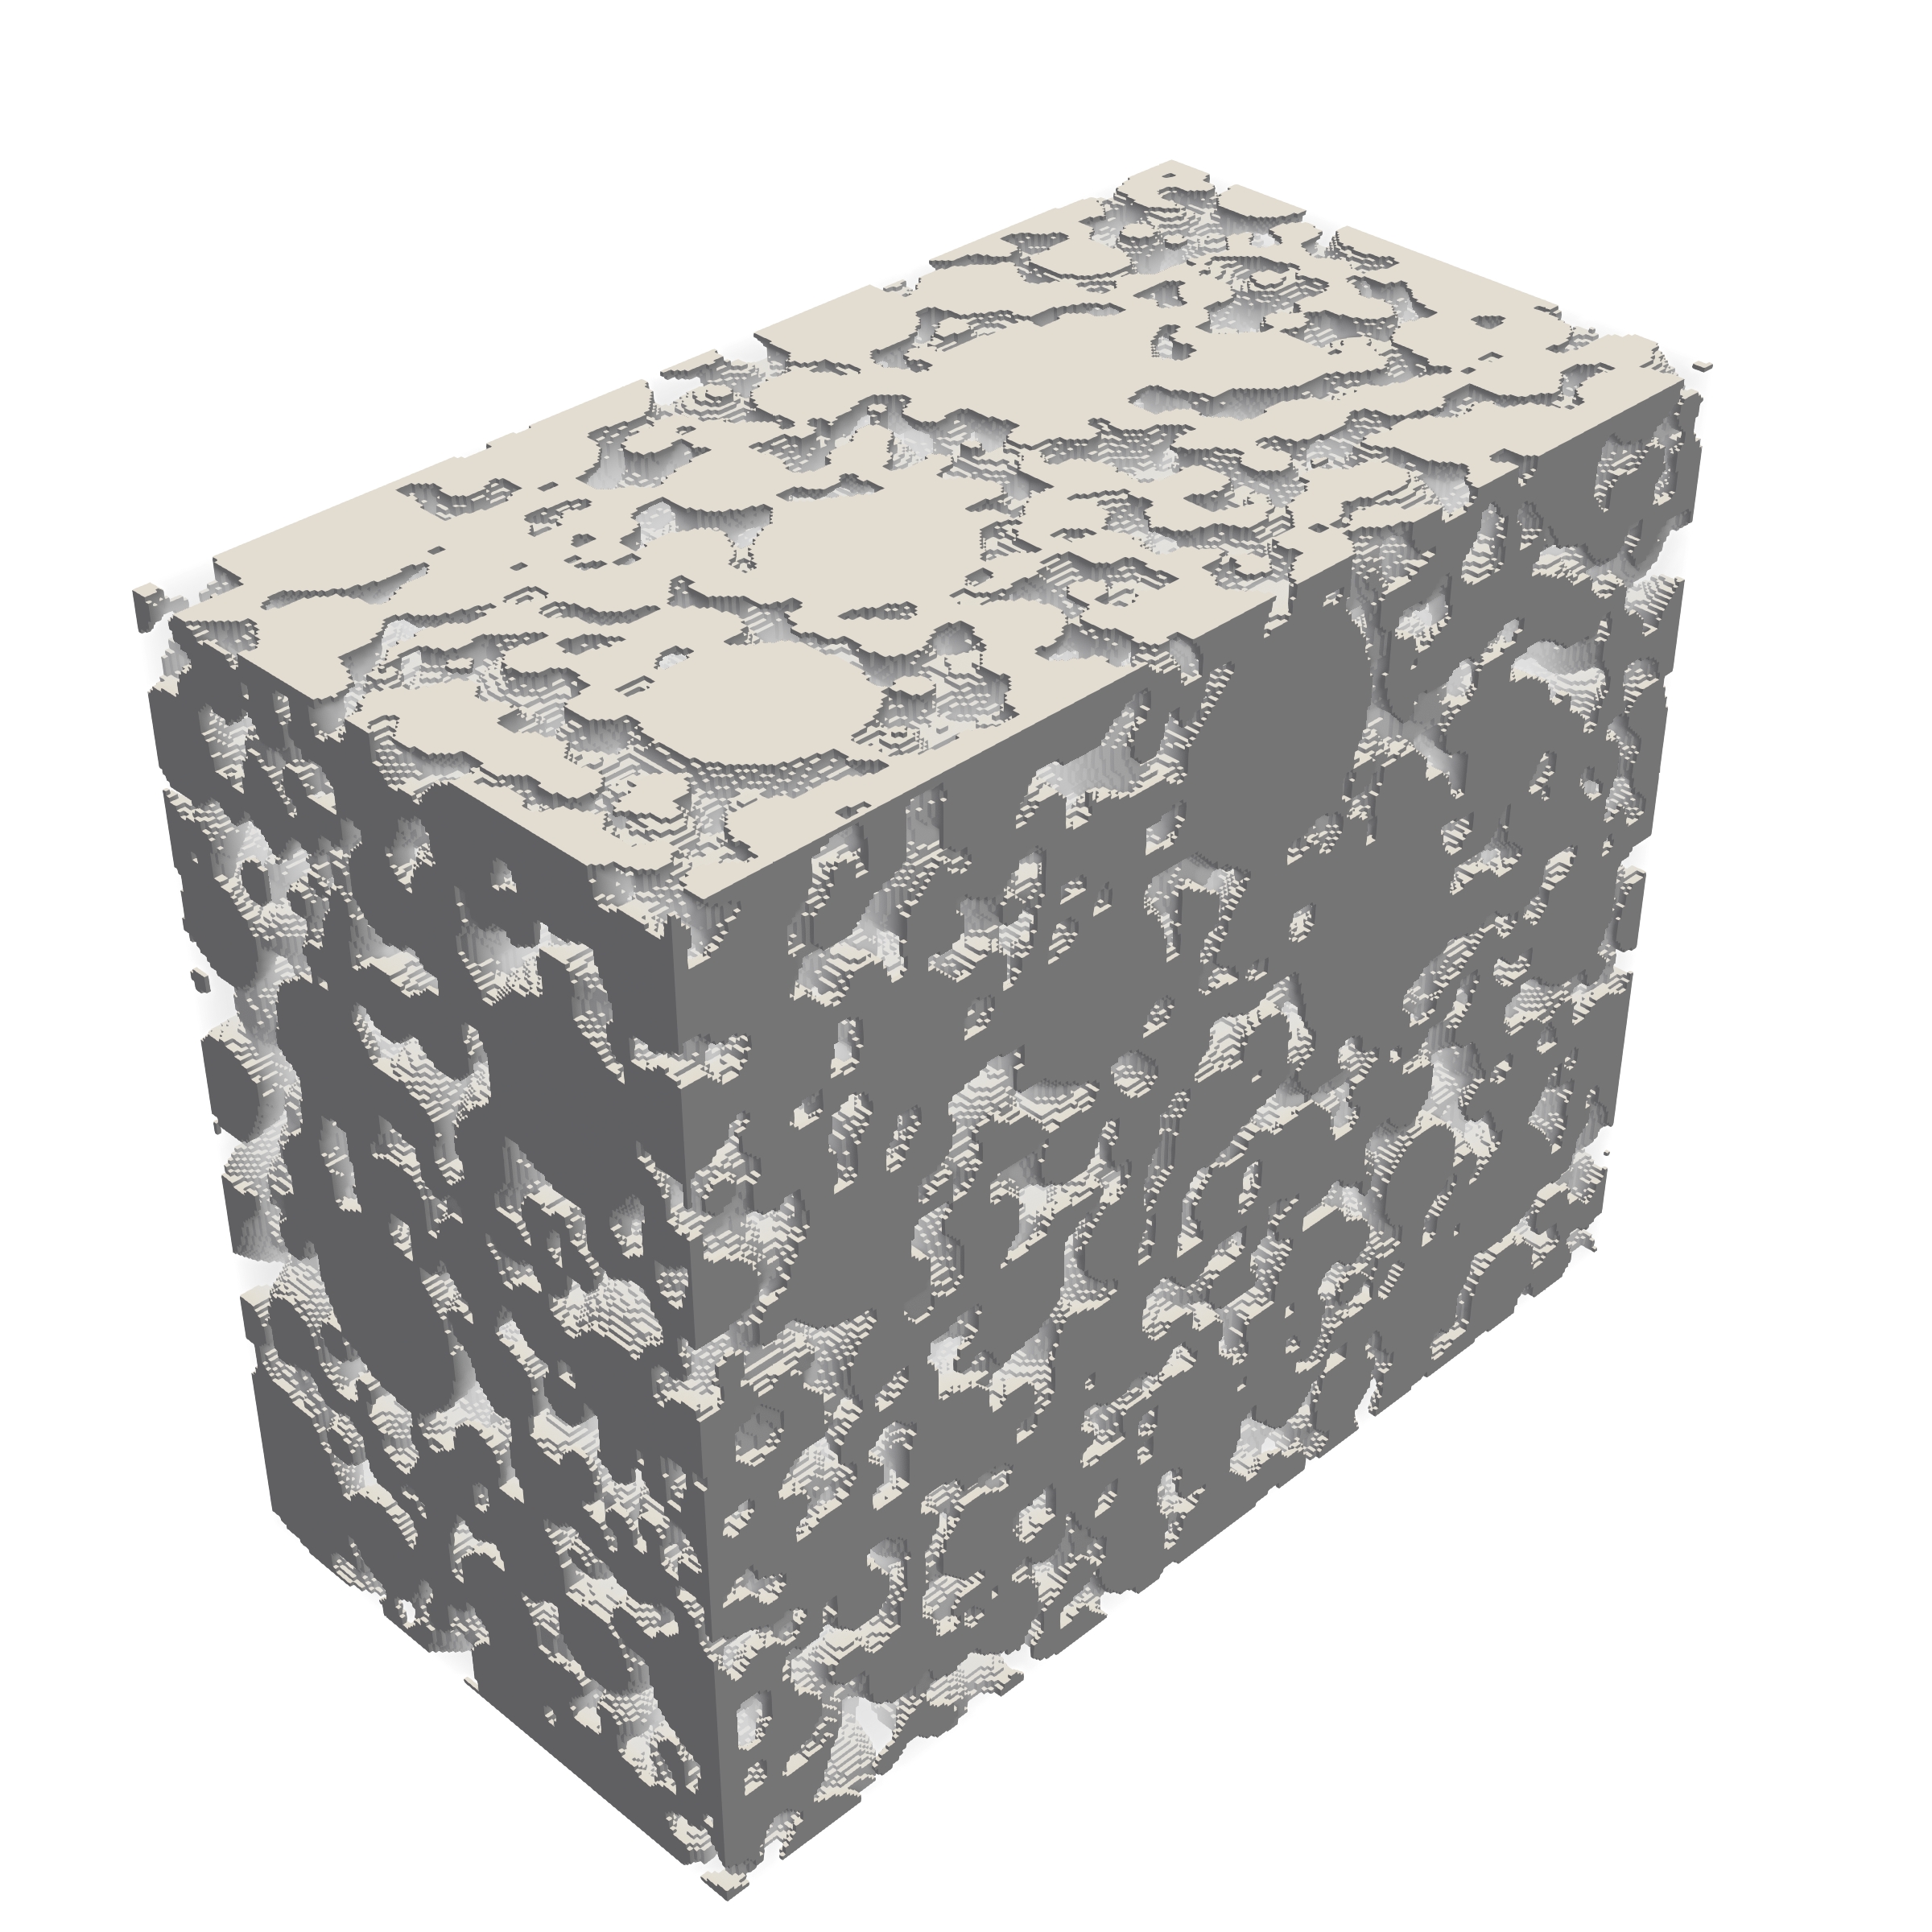
rock that was made from sintered glass beads. The synthetic rock was
fabricated to assess the possibility of controlling the microstructure
for linking scales in geomechanical behaviour and underground gas
migration. The image is obtained from X ray computed microtomography, it
was first segmented into a binary image of void and solid phases.
A threshold is subsequently applied to remove the void phase.
Description
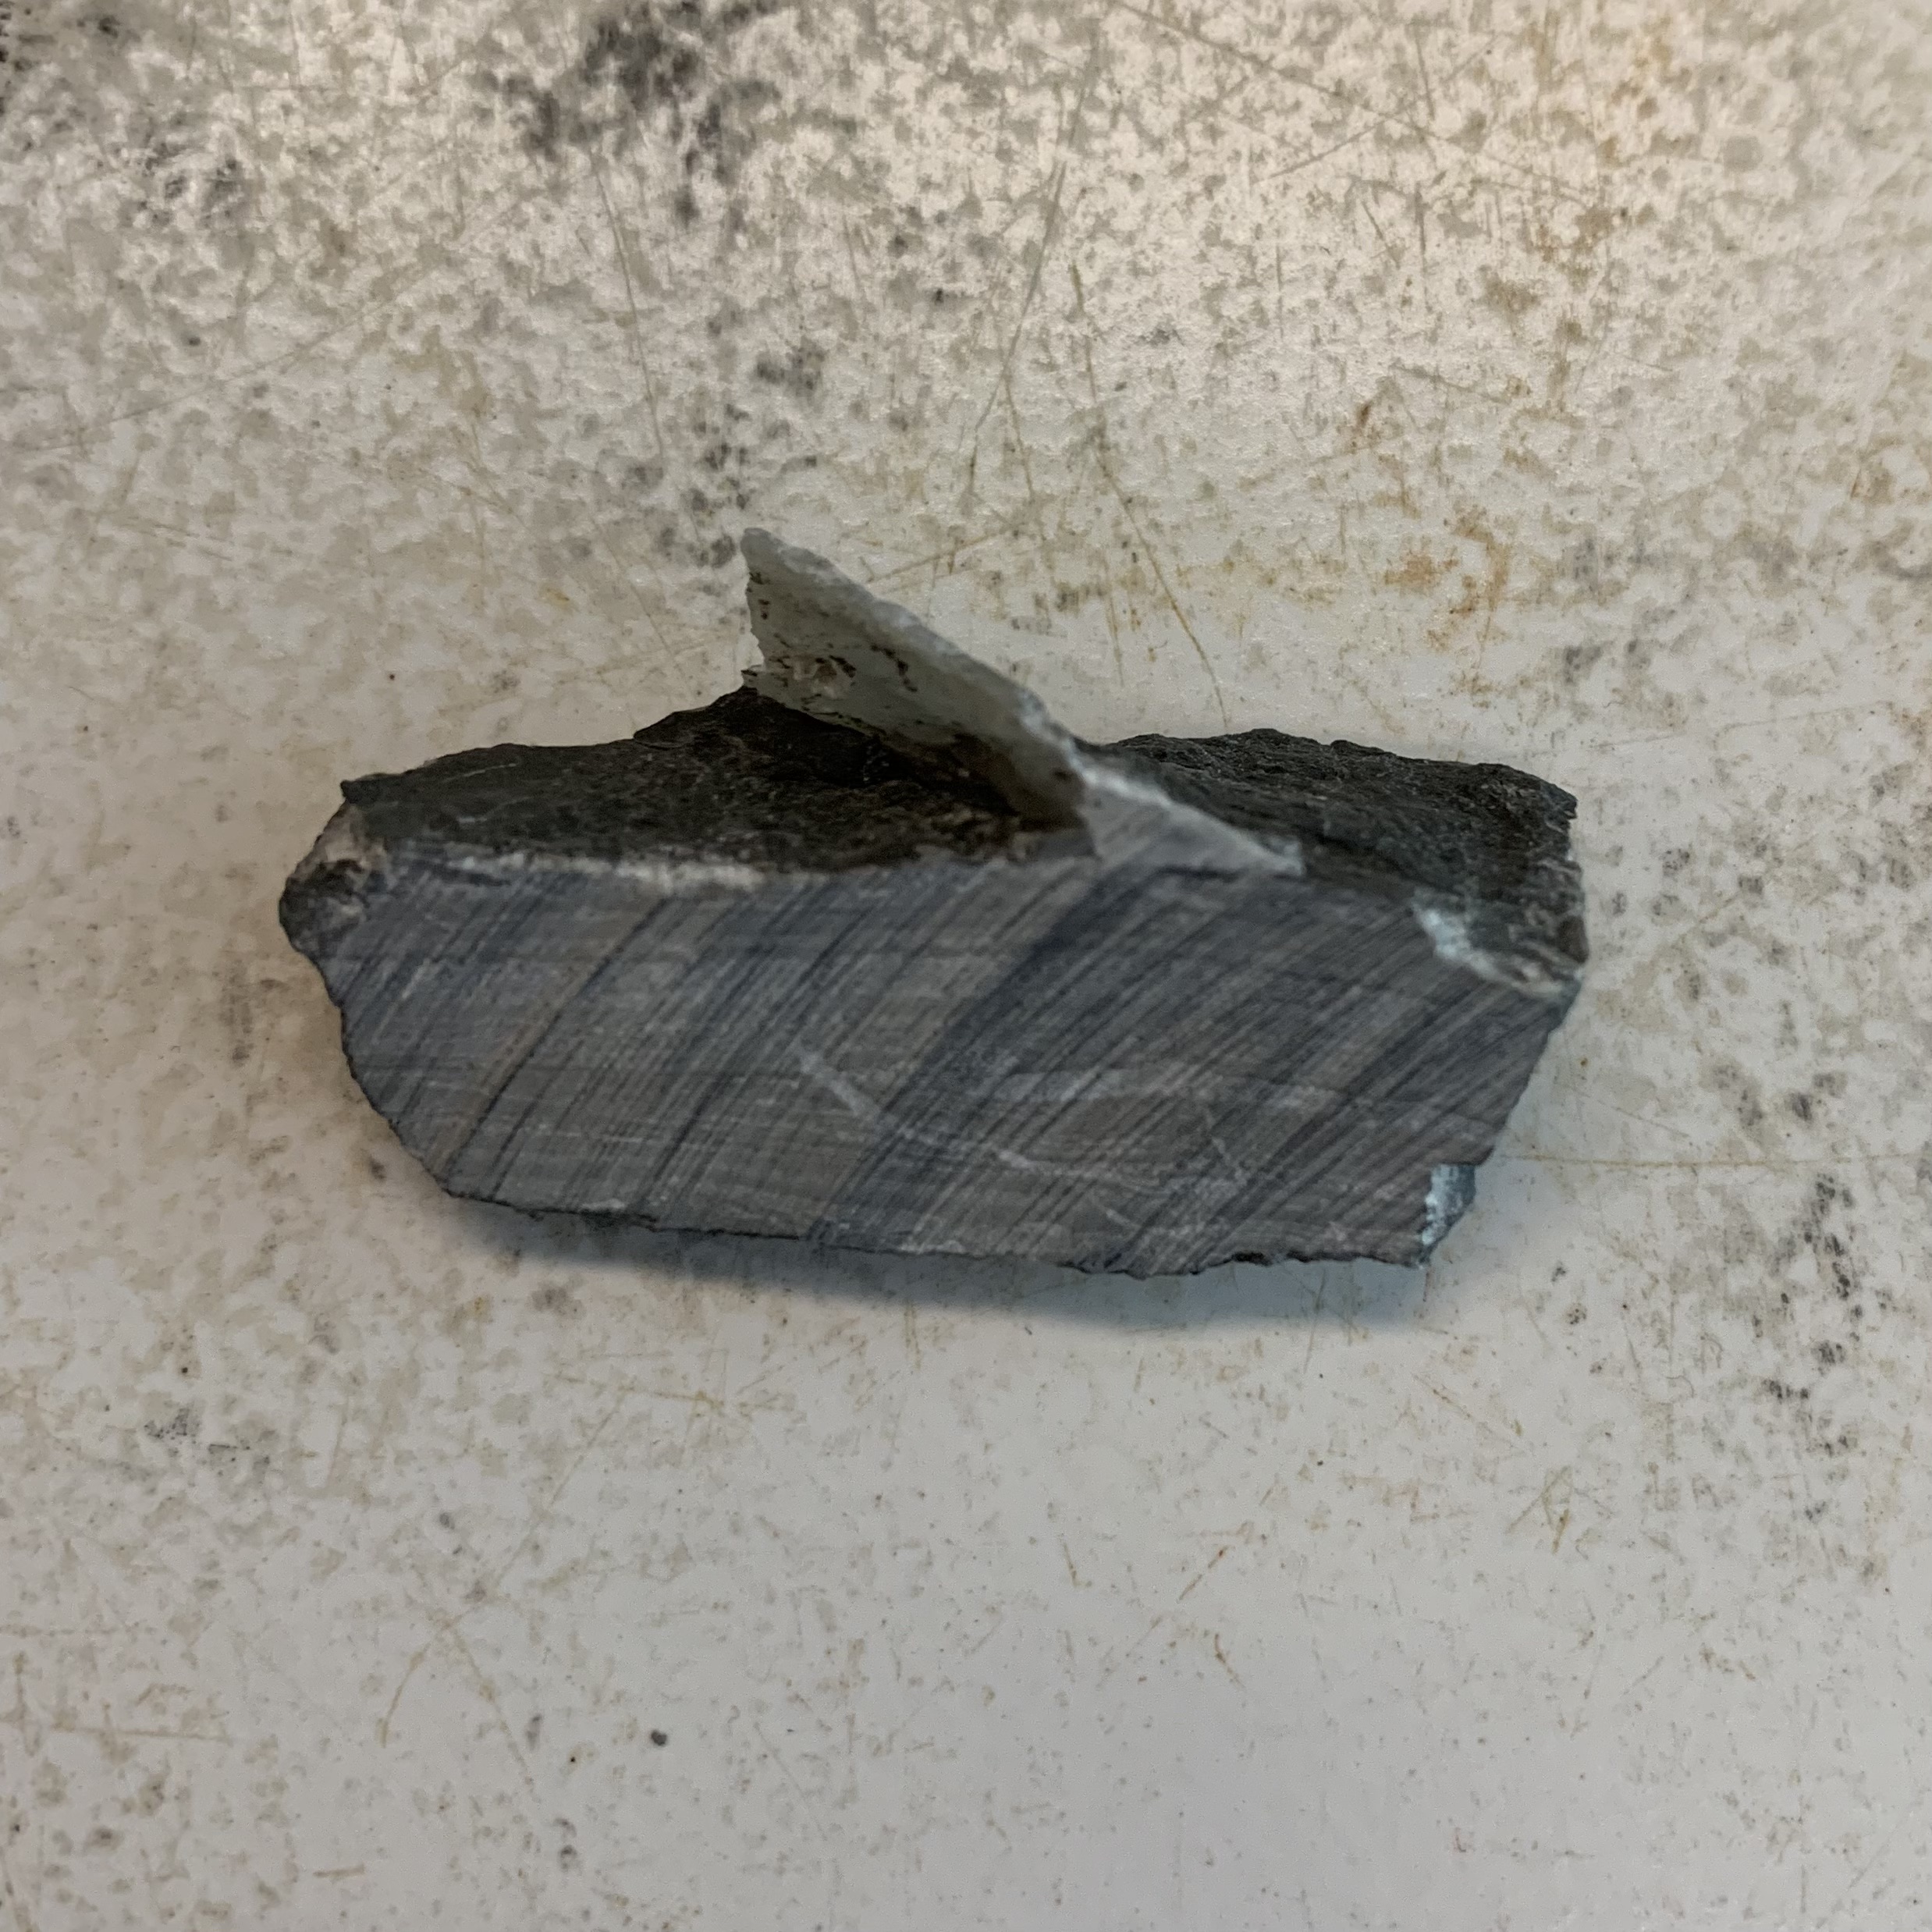
During the preparation of individual samples for further investigation, this particular piece of rock was serendipitously created. The image reveals a clay-sulfate rock with a distinct Anhydrite/Gypsum layer prominently protruding from the sample. This specimen proved especially suitable for microtomography scans to differentiate between the materials, demonstrating that sometimes, luck plays a role in our work.

Description
L’image montre une cellule déviatorique haute température et haute pression pour déterminer les propriétés thermo-hydro-mécaniques de l’agilite Callovo-Oxfordien. Un échantillon, équipé de jauges de déformation, est placé au centre de l’appareil. Les multiples vannes bleues à droite suggèrent la complexité et la précision de ce type de test, ainsi que les exigences techniques élevées de l’expérimentation. L’ordinateur flou à gauche, en arrière-plan, correspond à la partie dédiée au traitement des données.
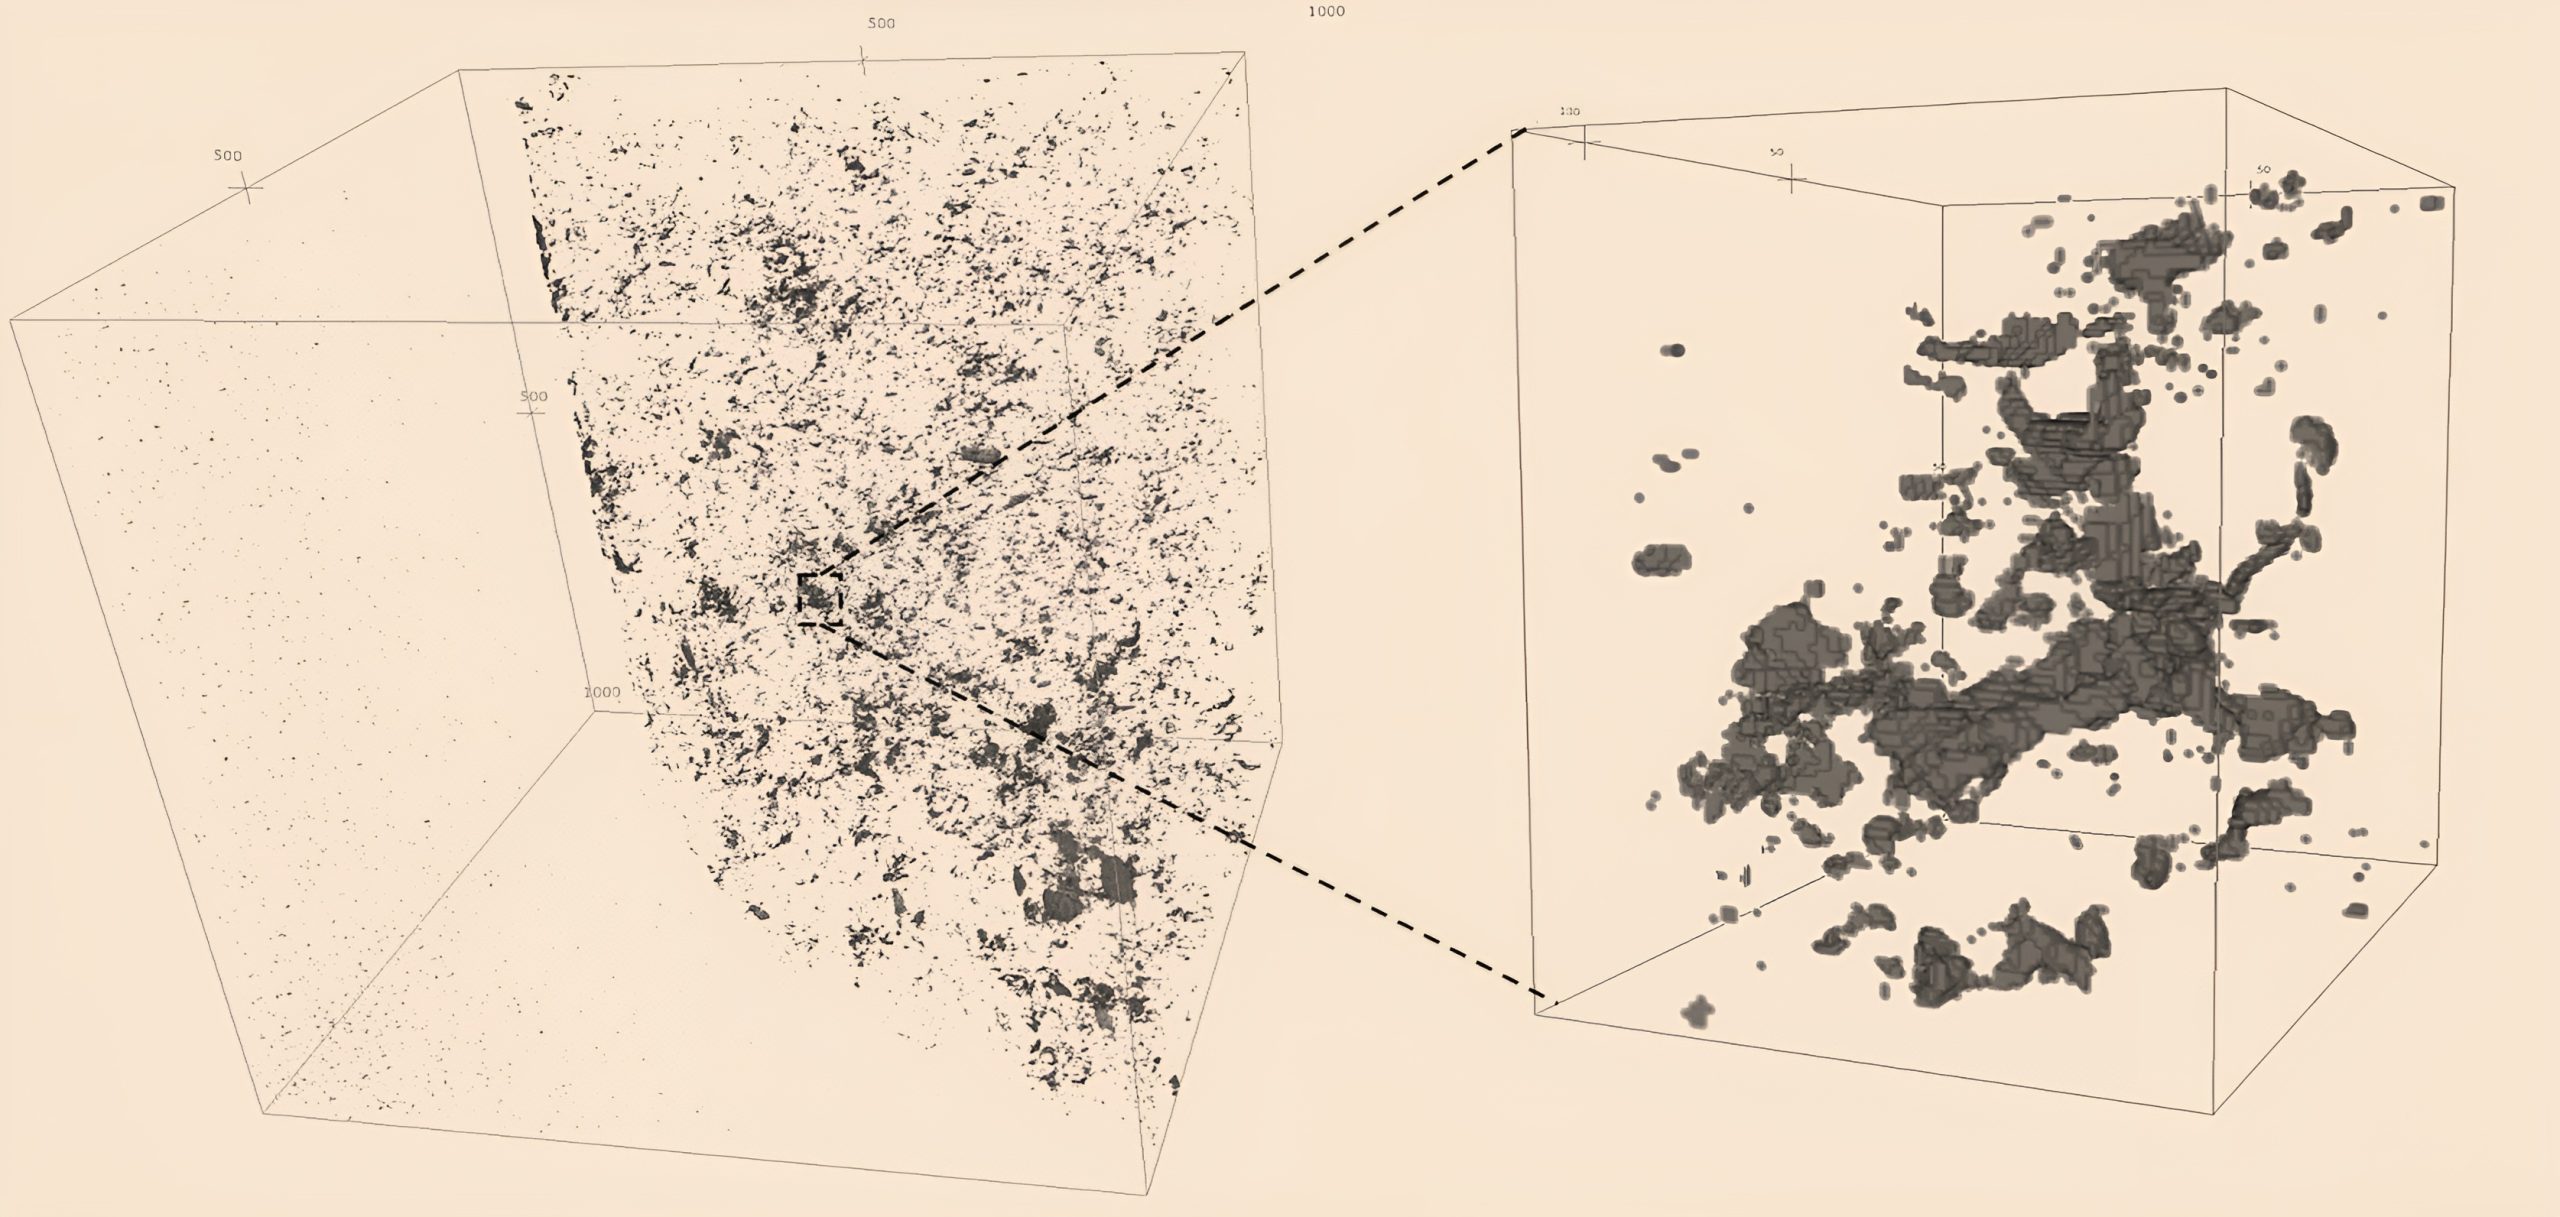
Description
Description
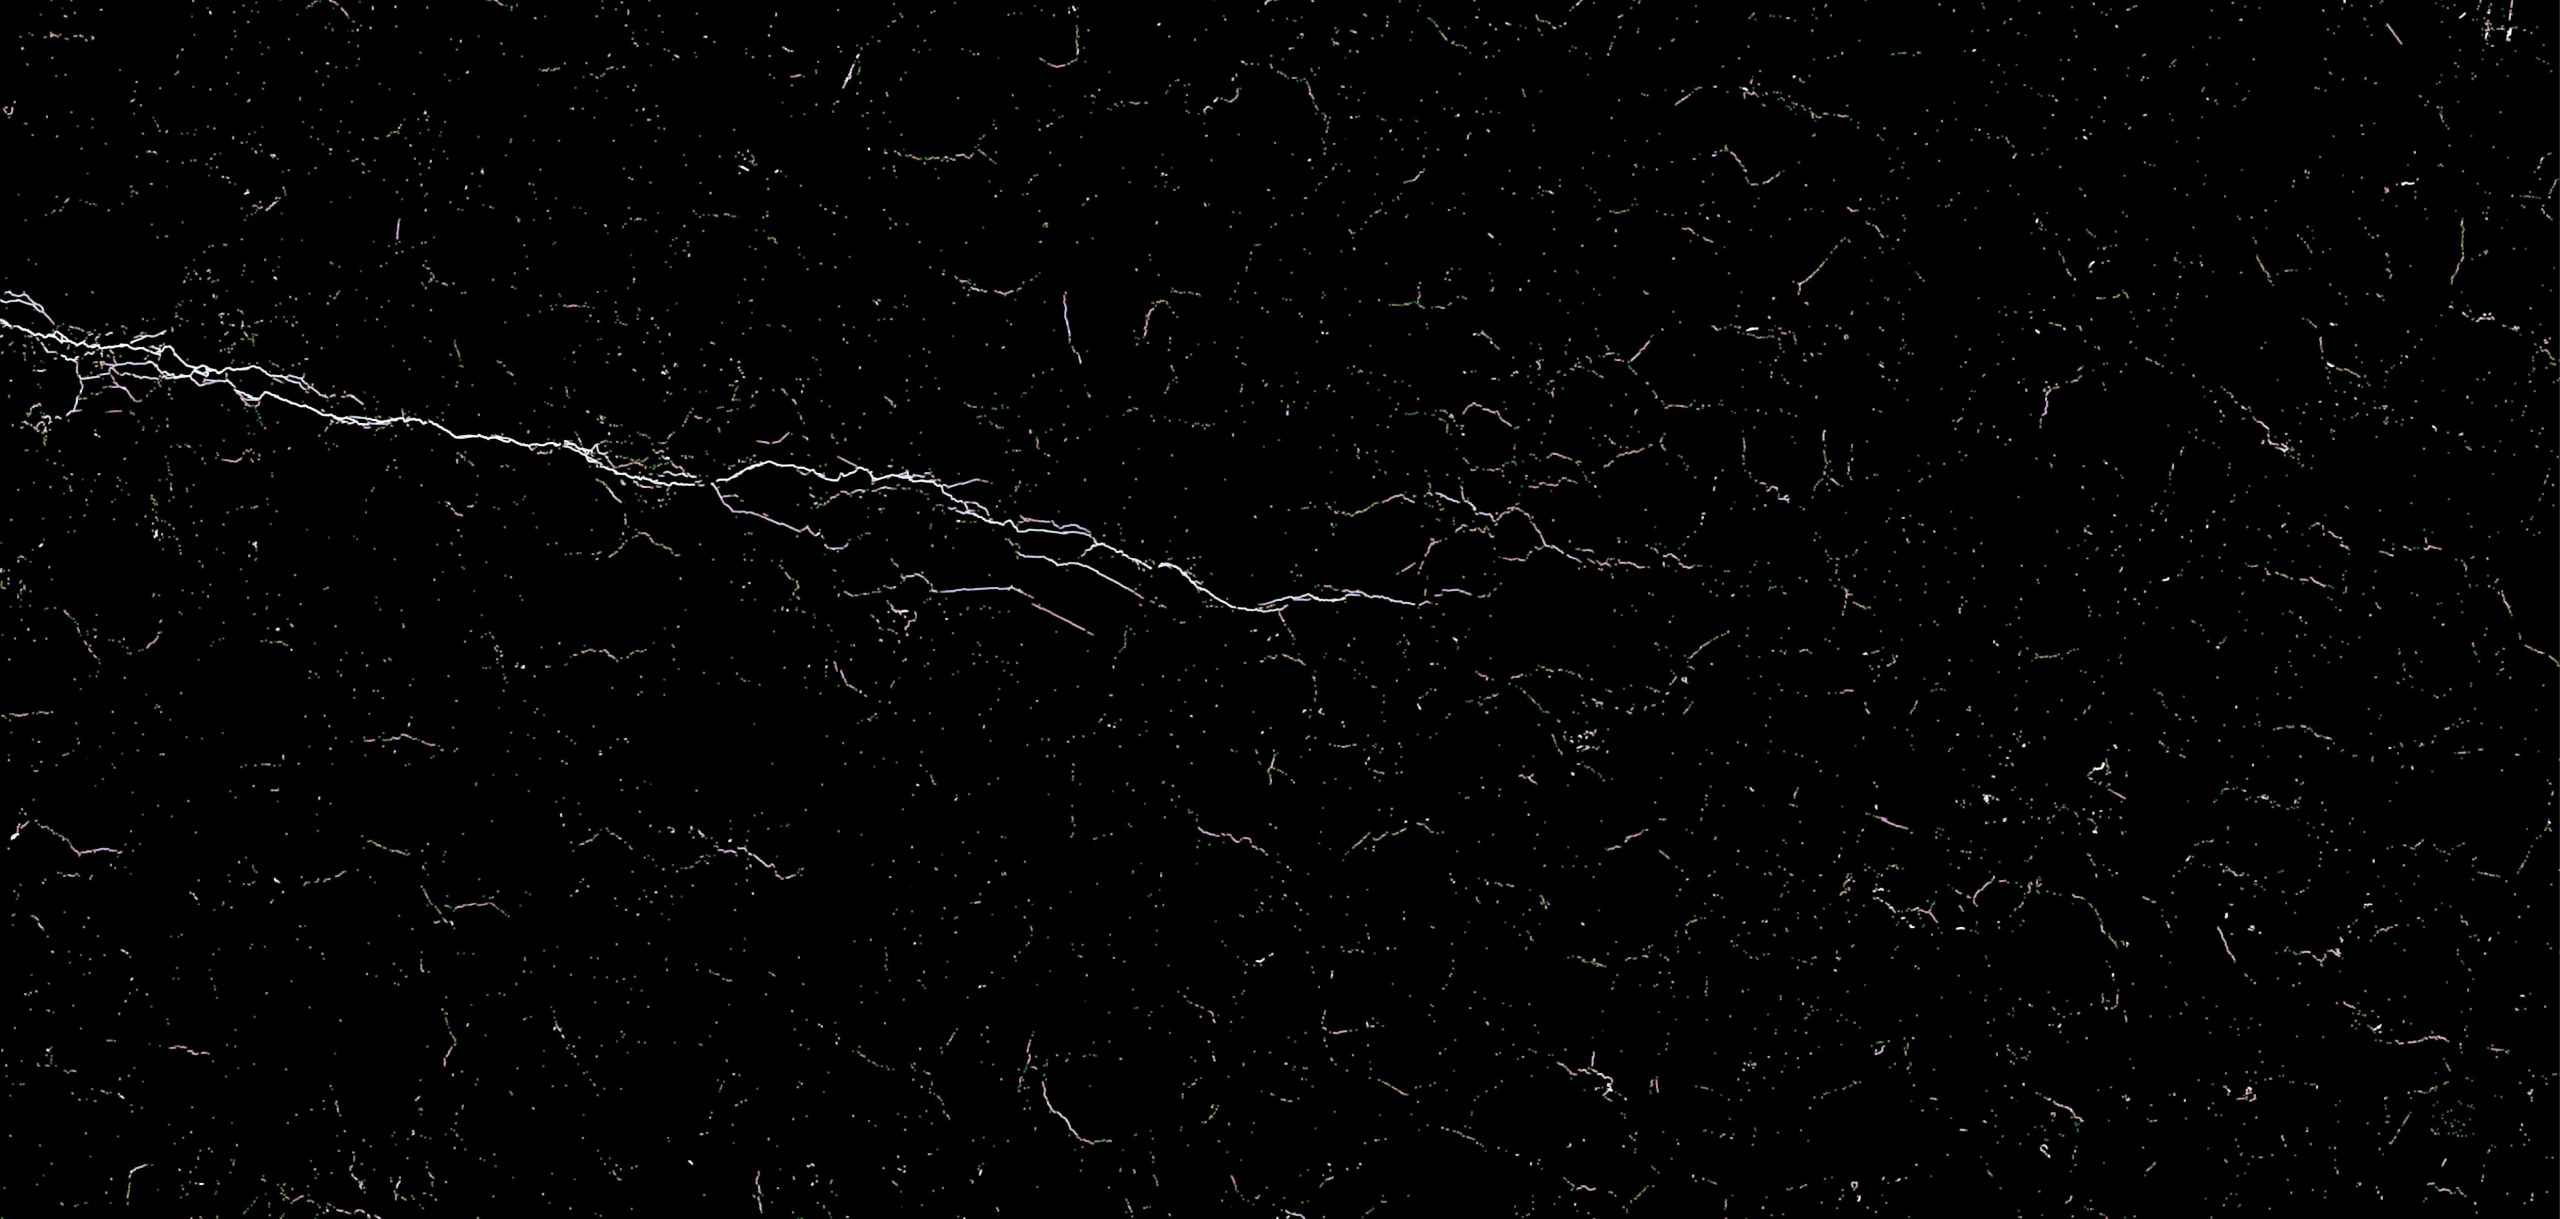
Microcrack densities captured via back-scattered electron imaging at the tip of a tensile crack in Carrara marble, highlighting the complex morphology of rock fractures.

Description

Description
Schéma présentant la fracturation radiale sur la paroi du tunnel causée par le gonflement d’un matériau bitumineux remplissant la section du tunnel, analysée par des calculs en élément finis enrichis par des éléments joints.

Description
Schéma illustrant la propagation d’une fissure à la paroi d’un tunnel soumis à une injection de gaz, analysée par des calculs en élément finis enrichis par des éléments joints pour un matériau biphasique.


